SAP Load Testing: A Serverless Approach with AWS
by Michele Donna and Francesco Bersani | on 07 AUG 2025 | in Amazon Athena, Amazon CloudWatch, Amazon Managed Grafana, Open Source, SAP on AWS, Serverless
Introduction
Conducting adequate load testing of SAP systems is a major factor in ensuring the systems can meet the performance and reliability expectations of the business when under peak usage. Typical scenarios that require load testing are new company/country rollouts, software release upgrades from ECC to S/4HANA, application patching (for example, support packages), S/4HANA transformation projects, or migration to SAP RISE. To ensure stable operations after such large-scale changes, it is recommended to perform load tests before any production cutover to avoid performance-related issues. In this post, you will learn how to implement and use a load test platform on AWS to inject different types of load into an SAP ERP system deployed either on premises or on RISE.
What is SAP Load Testing?
Load testing in SAP consists of systematically injecting various types of load into a system to measure its behavior under heavy load conditions. The process simulates multiple concurrent users accessing the system simultaneously, executing various SAP transactions, processing large volumes of data, and testing business-critical processes while measuring response times and resource utilization for proper performance evaluation.
Critical importance of load testing
The importance of SAP load testing cannot be overstated for several key reasons. From a business continuity perspective, it prevents system crashes during peak business hours, ensures critical business processes such as month-end closing run smoothly, and maintains user productivity and satisfaction. In terms of risk mitigation, load testing identifies performance bottlenecks before they impact operations, helps prevent costly system downtime, and reduces the risk of data processing errors. For resource optimization, it determines optimal hardware requirements, helps in capacity planning, and identifies areas for performance tuning. Regarding cost savings, proper load testing prevents over-provisioning of resources, reduces unexpected maintenance costs, and minimizes business disruptions. Without proper load testing, organizations risk system failures during critical business periods, loss of revenue due to system downtime, decreased user productivity, damaged business reputation, and increased maintenance costs.
Traditional load testing challenges
The landscape of load testing has undergone a significant transformation in recent years. While established tools (for example, the test automation suite offered by Tricentis—including LoadRunner) have long been the go-to solutions for SAP ecosystems, their traditional approach comes with considerable factors that many organizations find increasingly challenging to justify. Traditional load test tools are often expensive to procure and operate in terms of licenses, infrastructure, and expert skills.
Serverless load testing with AWS
Modern load testing approaches have evolved to embrace serverless architectures, particularly using AWS native services. By leveraging services like AWS Lambda, Amazon EventBridge, AWS Batch, AWS Fargate, AWS Step Functions, AWS Systems Manager, and Amazon CloudWatch, organizations can create scalable, cost-effective load testing solutions for SAP systems. This serverless approach eliminates the need for maintaining dedicated testing infrastructure and allows for on-demand test execution. The combination of AWS Step Functions to orchestrate the test scenarios and Amazon S3 or Amazon DynamoDB to store test results creates a robust, automated testing framework that can simulate thousands of concurrent users while providing detailed performance metrics and insights.
The benefits of serverless load testing are substantial: pay-per-use pricing (for many services this fits within the AWS Free Tier), zero infrastructure maintenance, automatic scaling capabilities, and significantly reduced complexity in test setup and execution.
When to perform load tests
SAP load testing is a key part of the overall non-functional testing that SAP customers must consider. Load testing should be performed before going live with a new SAP implementation, after major system upgrades or patching, when adding new business processes, before peak business periods such as year-end closing, and when planning for business growth.
Planned business events that typically generate exceptional system loads, such as month-end or year-end financial closing, require proactive performance assessment to ensure smooth operations. Additionally, when organizations plan to integrate new business entities or implement new complex processes, load testing becomes essential to validate the system’s capacity to handle the increased complexity and volume.
To maintain consistent system performance, organizations should embed load testing within their change management strategy. This systematic approach helps identify potential performance impacts from application modifications before they affect production environments. By integrating automated testing capabilities, organizations can more efficiently validate system performance while establishing a foundation for maintaining quality through future upgrades and integrations. This proactive stance on performance testing ultimately helps ensure system reliability and optimal user experience across the SAP landscape.
Solution architecture
SAP on AWS (native)
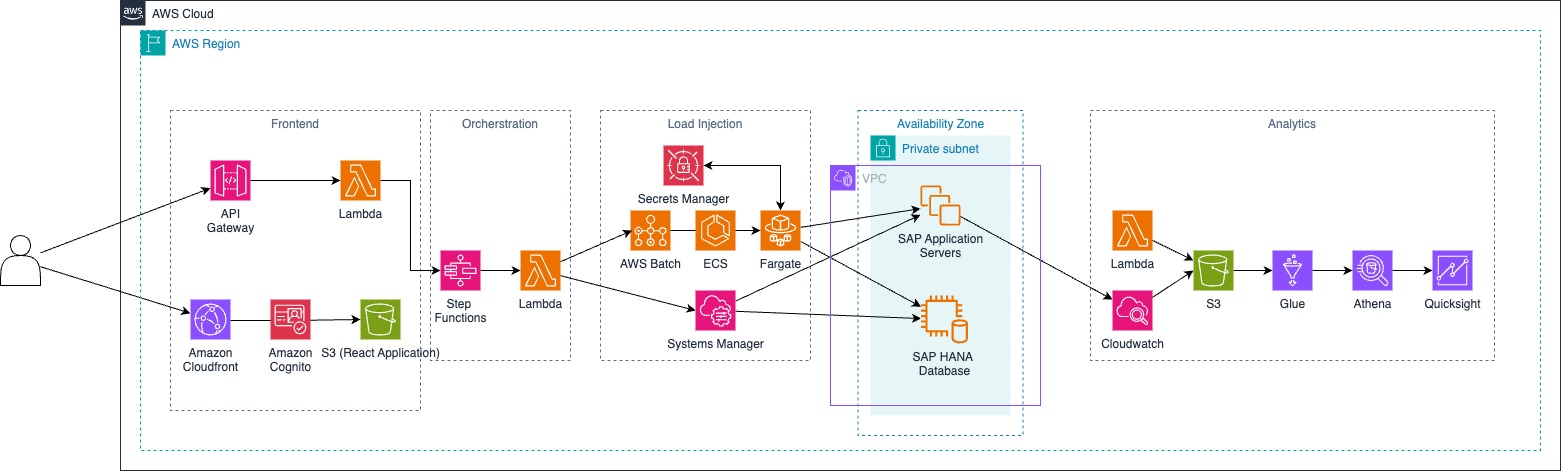
Figure 1: SAP on AWS Native architecture
RISE with SAP
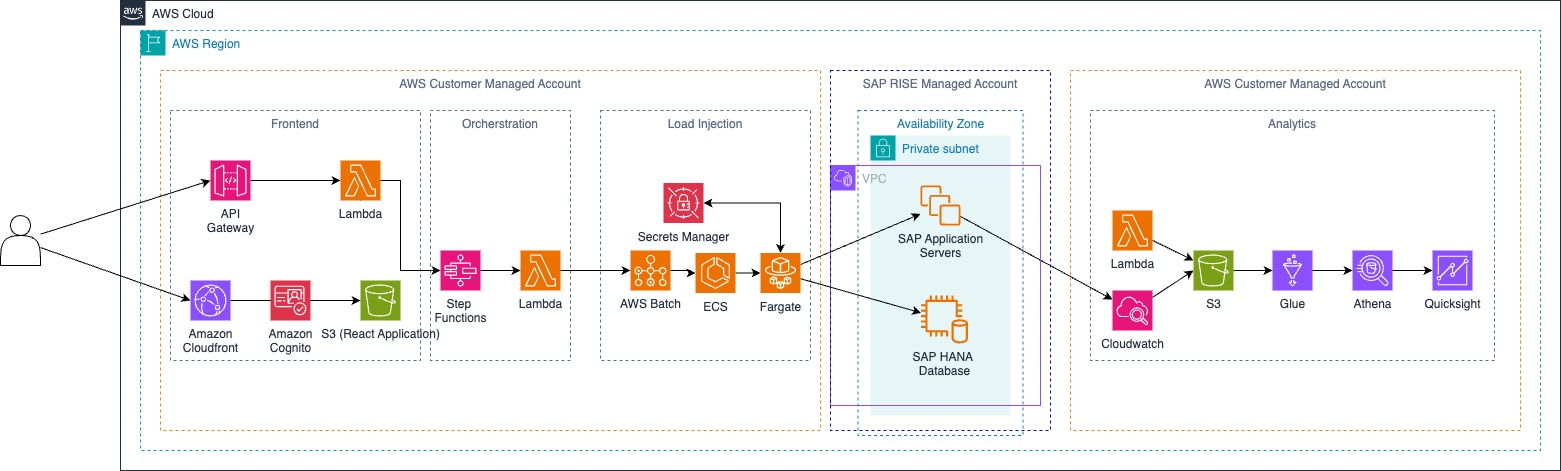
Figure 2: RISE architecture
Note: Some code adjustments might be required for extracting OS metrics from SAP systems running within RISE.
Testing scenarios
RISE environment
Application testing
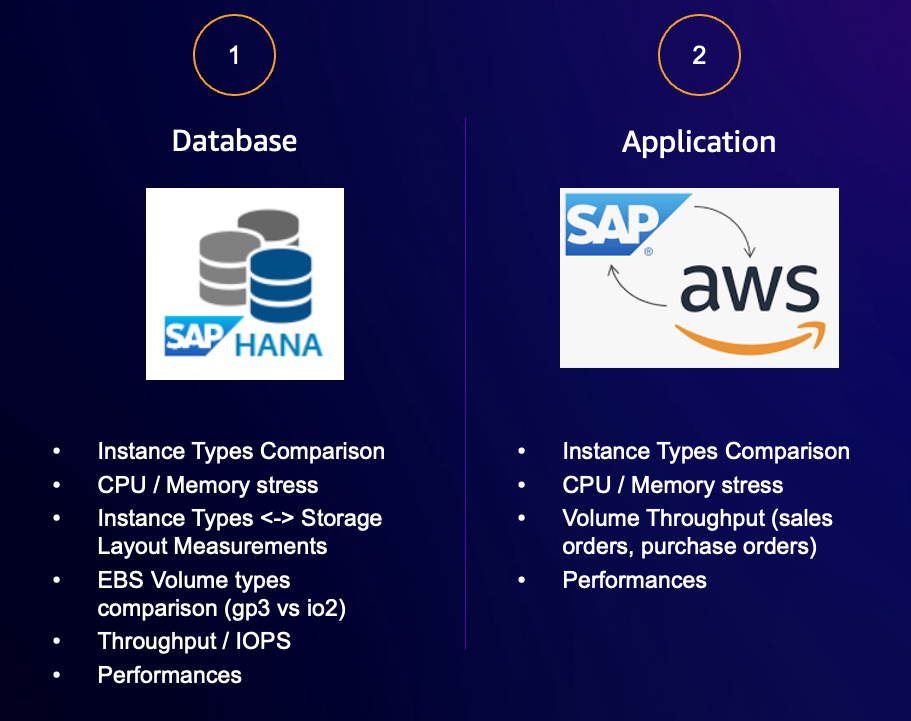
Figure 3: RISE load test types
HANA database load testing
This open-source solution generates realistic database workloads for SAP HANA systems, injecting large database insert/update/delete operations using the k6-sql module and the k6 scripting capabilities. Example:
import sql from "k6/x/sql";
import driver from "k6/x/sql/driver/hdb";
import secrets from 'k6/secrets';

const db = sql.open(driver, `hdb://${username}:${password}@${hanaHost}:${hanaPort}`);

export function setup() {
  db.exec(`
  CREATE COLUMN TABLE test_table (
    A INT GENERATED BY DEFAULT AS IDENTITY,
    B TEXT,
    C TEXT,
    D TEXT
    );
  `);
}

export default function () {
  // first insert
  let insert_result = db.exec(`
    INSERT INTO test_table (B, C, D)
    VALUES ('test', 'test', 'test');
  `);
  console.log("Row inserted");

  // then select
  let selectResult = db.query(`
    SELECT * FROM test_table
    LIMIT 10;
  `);
  console.log(`Read ${selectResult.length} rows`);
}

export function teardown() {
   db.exec(`DROP TABLE test_table;`);
   db.close();
 }
Monitoring components (based on HANA native tools and Amazon CloudWatch) focus on transaction throughput and response times, capturing detailed resource utilization patterns across the system. They analyze error rates and performance bottlenecks while providing insights into memory and CPU impact.
SAP Fiori and IDoc load testing
A k6-based framework designed for testing high-volume IDoc processing, ensuring robust business document exchange capabilities. The system supports dynamic IDoc payload generation for various document types (for example, sales orders—refer to the code repository for examples), with configurable load patterns including ramp-up, sustained, and peak testing phases. Deep integration with AWS CloudWatch enables metrics collection and threshold-based performance validation.
Similarly, multiple parallel end-user interactions via the SAP Fiori frontend can be simulated to test end-user experience when the system enters a heavy-load state.
Performance monitoring focuses on two key areas. First, Fiori access or IDoc processing performance tracks throughput rates, processing times, queue behavior under load, and error patterns while validating end-to-end processing. Second, system impact analysis examines SAP response times, database performance, network utilization, and overall resource consumption patterns. A JavaScript script can be used for injecting sales-order IDocs into an SAP system or simulating SAP Fiori user interactions:
import http from 'k6/http';
import { check, sleep } from 'k6';
import { Rate } from 'k6/metrics';
import encoding from 'k6/encoding';
import secrets from 'k6/secrets';

// get information from secret
const username = await secrets.get('username');
const password = await secrets.get('password');
const sapClient = await secrets.get('sapClient');
// get baseUrl from environment variable
const sapBaseUrl = __ENV.SAP_BASE_URL;
// set the sap client in url parameter
let sapClientStringParameter = "";
if (sapClient.match(/^[0-9]{3}$/)) {
  sapClientStringParameter = `?sap-client=${sapClient}`;
}

// define your url path
const urlPath = "/sap/bc/idoc_xml";
// build the final url
const url = `${sapBaseUrl}${urlPath}${sapClientStringParameter}`;

// start your load test logic
const xmlfile = open('./sample_idoc_ID1.xml');
const todayDate = new Date().toISOString().slice(0, 10);
const newDate = todayDate.replace("-", "");

export const successRate = new Rate('success');

export const options = {
  vus: 5,
  duration: '60s',
  insecureSkipTLSVerify: true,
};

export default function () {
  const data = getAndConvertIdocXml();
  const credentials = `${username}:${password}`;
  const encodedCredentials = encoding.b64encode(credentials);

  const httpOptions = {
    headers: {
      Authorization: `Basic ${encodedCredentials}`,
      "Content-Type": 'text/xml'
    },
  };

  check(http.post(url, data, httpOptions), {
    'status is 200': (r) => r.status == 200,
  }) || successRate.add(1);

  sleep(5);
}

function getAndConvertIdocXml() {
  let result = xmlfile.replace("{{GENERATED_IDOC_NUMBER}}", Math.floor(Math.random() * 100000000000000));
  result = result.replace("{{GENERATED_MESSAGE_ID}}", Math.floor(Math.random() * 100000000000000));
  return result;
}
An XML IDoc sample can be generated via transaction WE19 (the IDoc test tool). Once the IDoc has been generated, convert the XML into a template with string placeholders GENERATED_IDOC_NUMBER and GENERATED_MESSAGE_ID to be filled at runtime when the load test script is executed.
Note: Make sure the ALE configuration (for example, sender/receiver and partner number/port) matches your SAP system so inbound IDoc processing succeeds with status 53 (Application document posted).
Both testing approaches deliver significant advantages through realistic business process simulation and scalable test scenarios. The comprehensive monitoring framework, coupled with cost-effective open-source tools, provides deep integration with AWS services for enhanced visibility and control.
SAP on AWS (native environment)
In addition to the RISE environment options, the following tests can be performed when running SAP natively on AWS.
Infrastructure testing
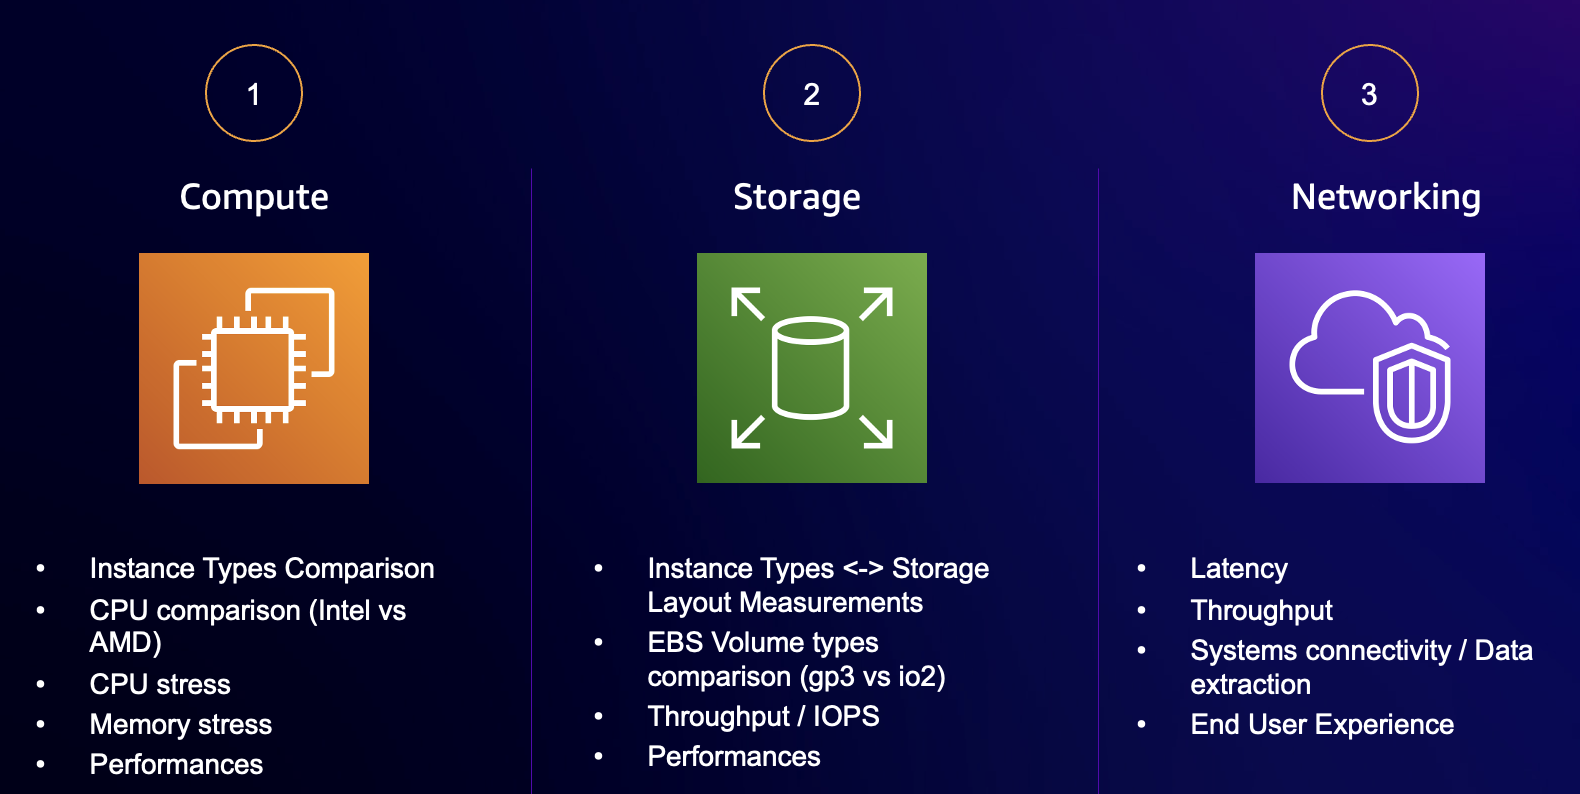
Figure 4: Infrastructure load test types
The diagram shows three main testing scenarios that target different infrastructure aspects:
Compute testing scenario
This scenario evaluates the computational aspects of SAP systems through systematic stress testing using operating system tools. For CPU load simulation, similar to the AWS Fault Injection Simulator (FIS), tools like stress-ng generate precise CPU utilization patterns, for example maintaining 75% CPU load across all cores, or memory stress testing to consume 80% of available RAM. A tutorial is available here. These tools, combined with SAP’s native performance metrics (for example, gathered by sapsocol / Workload Monitor), provide comprehensive insights when comparing instance types (Intel versus AMD), helping determine optimal compute configurations for specific SAP workloads. The testing methodology includes gradual load increments, sustained high-utilization periods, and monitoring of system behavior under various computational stress conditions.
Storage testing scenario
This scenario focuses on storage performance optimization through comprehensive testing using the Flexible I/O (FIO) tester. FIO enables precise measurement of storage performance characteristics through various test patterns such as random read/write testing, sequential read performance, and IOPS testing for EBS volumes. For further details on FIO benchmarking on AWS see this guidance. FIO tests are executed across different EBS volume types (for example, gp3 versus io2) to analyze:
- Maximum throughput capabilities
- IOPS performance under various workloads
- Latency patterns at different queue depths
- Storage system behavior under sustained load
Networking testing scenario
This scenario examines network performance and connectivity by measuring critical network parameters that affect SAP system performance. A key feature is network delay simulation using operating system commands like tc (traffic control) in Linux. This allows precise control over network conditions by introducing artificial latency, packet loss, and bandwidth limitations. For instance, using commands such as tc qdisc enables the simulation of real-world network conditions, including:
- Introducing specific latency values (for example, 300 ms delay)
- Simulating packet loss scenarios (for example, 5% packet loss)
- Creating bandwidth throttling conditions
- Implementing jitter in network communications
These network impairment simulations provide valuable insights into how SAP systems behave under various network conditions. This approach helps organizations understand their SAP system’s resilience to network issues and optimize their network configurations accordingly. This scenario can be used to introduce additional latency across SAP interconnected systems (for example, ERP ↔ BW) and measure data extraction processes by simulating a migration project where ERP runs on premises and BW is migrated to AWS.
Load test monitoring
Real-time monitoring options
CloudWatch dashboards
Custom Amazon CloudWatch dashboards present critical performance metrics in a unified view, combining infrastructure metrics, application performance data, and custom test metrics into comprehensive visualizations. Key performance indicators are organized into logical groups: SAP technical metrics such as dialog and database response time, number of system dumps, active users for SAP operations teams, and OS metrics such as CPU, memory usage, storage IOPS, and throughput for infrastructure operations teams. The dashboards feature automated alerting based on predefined thresholds, enabling proactive response to performance issues during test execution. Historical data retention allows trend analysis and performance comparison across different test runs, providing valuable insights for capacity planning and system optimization.
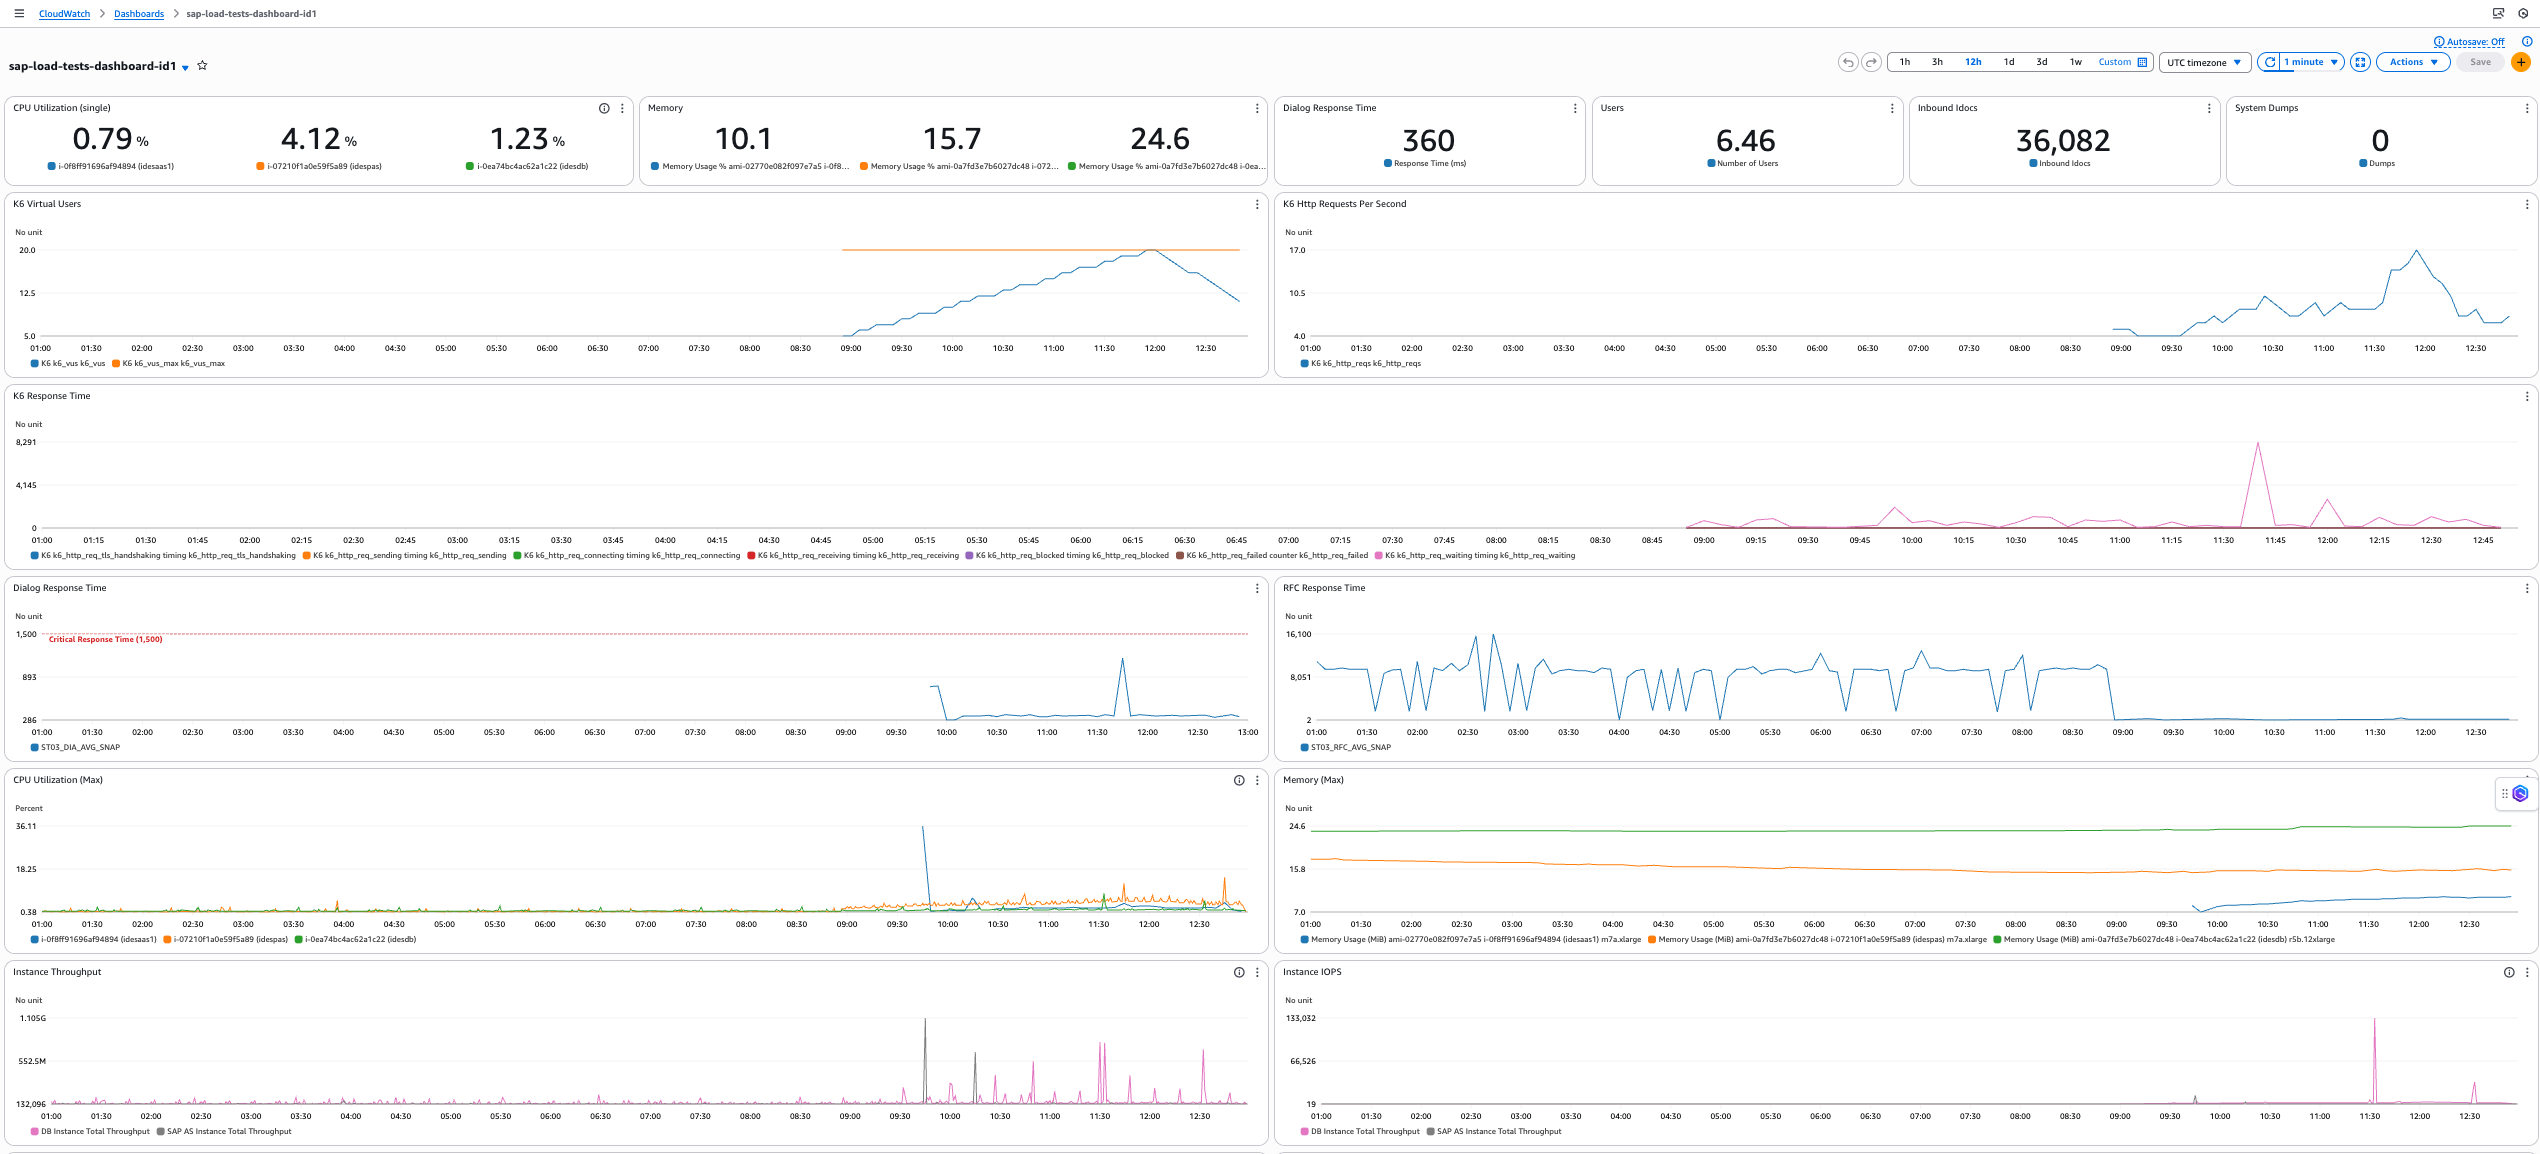
Figure 5: CloudWatch dashboard metrics during load tests
Amazon Managed Grafana (optional)
As an alternative or complement to CloudWatch dashboards, Amazon Managed Grafana offers enhanced visualization capabilities and deeper analytical features. The service enhances the monitoring experience through advanced data correlation and custom metrics, providing rich visualization options with both pre-built and custom panels. It supports cross-account and cross-region metric aggregation, enabling comprehensive monitoring of complex SAP landscapes. Team-based access control and dashboard sharing facilitate collaboration across different stakeholder groups, while native integration with AWS services (in this scenario Amazon CloudWatch) and external data sources expands monitoring capabilities.
Real-time metric exploration and ad-hoc analysis capabilities support immediate investigation of performance issues, complemented by automated dashboard provisioning through infrastructure as code. The built-in alerting and notification channels ensure timely response to performance anomalies. The combination of CloudWatch metrics and Grafana visualizations creates a powerful monitoring ecosystem that supports both real-time operational monitoring and long-term performance analysis, enabling data-driven decisions for SAP system optimization.
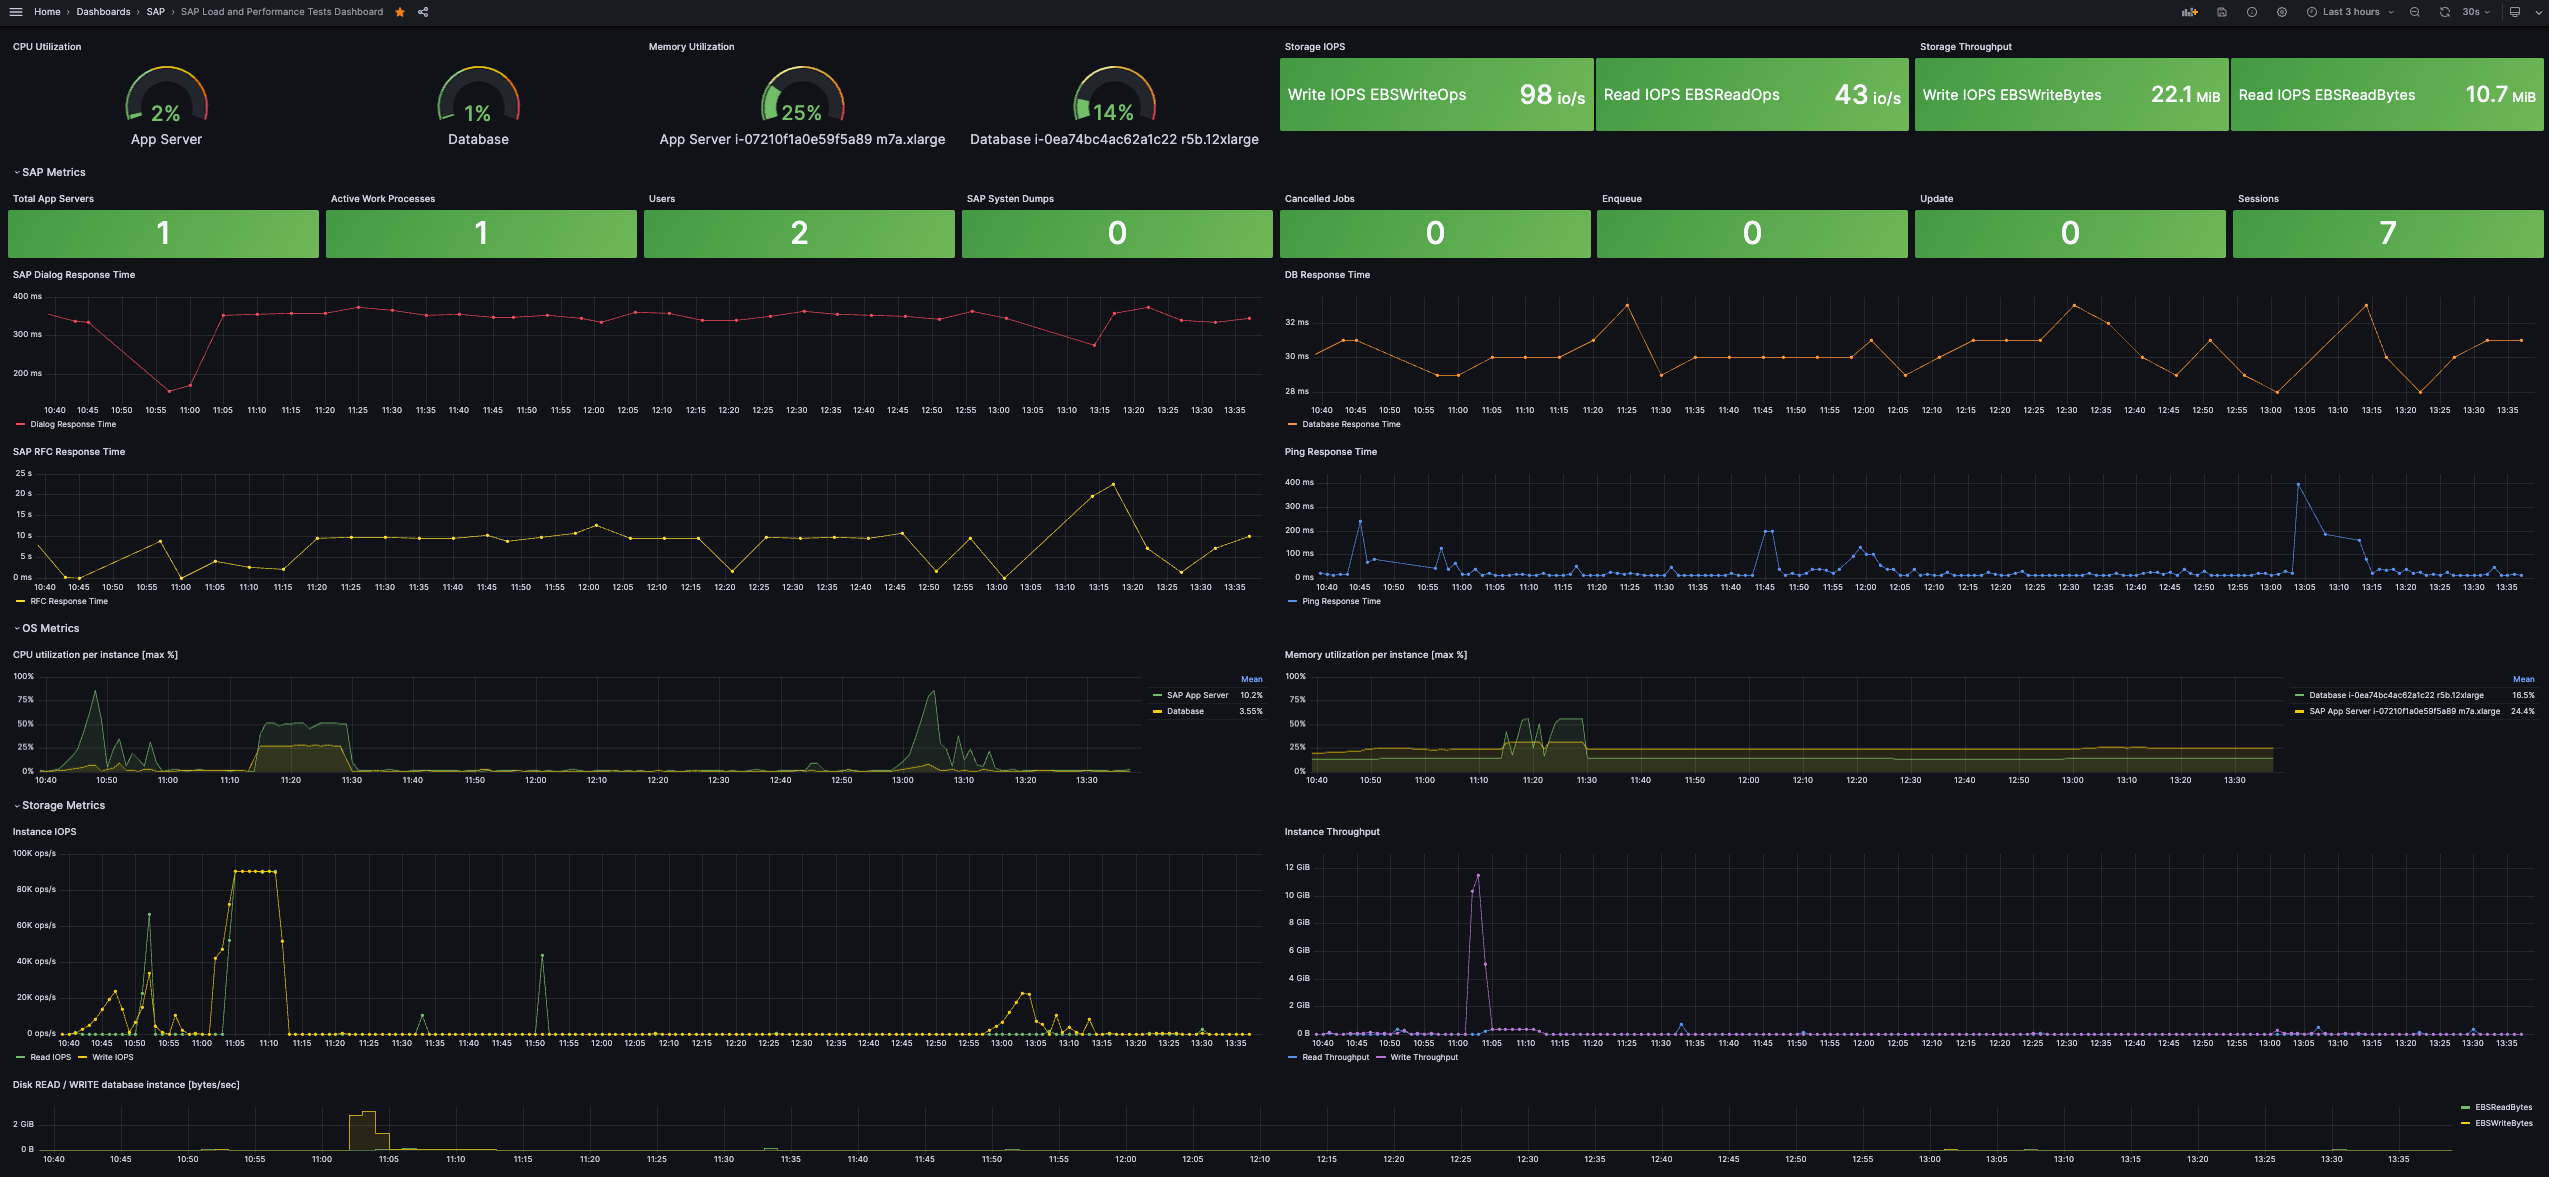
Figure 6: Grafana dashboard metrics during load tests
In both cases SAP NetWeaver-specific metrics can be gathered into CloudWatch by using the open-source solution linked in the AWS post.
Load testing workflow
Orchestration and execution flow
The workflow follows a structured sequence of events across AWS services to execute and monitor SAP system load tests:
- Test initiation: A Step Functions state machine starts the workflow based on end-user input in a dedicated web application UI, orchestrating the entire process. The input payload determines which scenario will be executed (SAP, HANA, or infrastructure).
- Test execution: Specific Lambda functions, authenticating via AWS Secrets Manager, execute the load testing scenarios. The functions contain the logic and parameters for each scenario.
- System access: AWS Systems Manager and AWS Fargate provide secure access to the SAP landscape within the VPC, enabling test execution across SAP application servers (application-level testing), SAP HANA database (database-level testing), and operating system level (CPU, memory, storage, and network testing).
- Monitoring and data collection: Amazon CloudWatch collects and processes performance metrics from test execution, gathering data from all SAP components and infrastructure elements.
- Real-time visualization options: Direct CloudWatch dashboards for real-time monitoring, or Amazon Managed Grafana (optional) for advanced visualization and analysis, with optional integration through AWS IAM Identity Center (successor to AWS Single Sign-On) for authentication.
- Long-term data processing and analysis: Performance metrics are stored in Amazon S3, processed by AWS Glue, queried through Amazon Athena, and visualized via Amazon QuickSight (optional).
To streamline the user experience, a React application authenticates users with Amazon Cognito, hosts front-end assets on Amazon CloudFront, and uses Amazon API Gateway to interact with the Step Functions workflows so users can launch and monitor load tests directly.
Implementation
Get started today:
- Clone the GitHub repository.
- Follow the step-by-step deployment guide.
- Run your first load test in your SAP system—from setup to results—in under 60 minutes.
Costs
| Service | Cost | Description |
|---|---|---|
| Step Functions | Free Tier | Includes 4,000 free state transitions per month |
| Lambda | Free Tier | One million free requests per month and 400,000 GB-seconds of compute time per month |
| Secrets Manager | $0.40 per secret per month | One secret is required for storing user credentials and other parameters |
| Systems Manager | Free | No additional charges for run command |
| CloudWatch | $3.00 | Basic Monitoring Metrics + 10 Custom Metrics |
| CloudFront | $0.12 per month | |
| Cognito | $6.22 per month | Five users, 100 token requests per user, one app client |
| ECR | $0.07 per month | Two images, total storage 750 MB per month |
| Fargate | $6.32 per month | 16 vCPUs, 16 GB memory, 10 tasks per pod per month, 60 minutes duration |
| API Gateway | $0.35 per month | 10,000 REST API requests per month |
| S3 | Free Tier | 5 GB storage in S3 Standard, 20,000 GET requests, 2,000 PUT/COPY/POST/LIST requests, 100 GB data transfer out per month |
| Glue | Free Tier | Free for the first million objects stored |
| Athena | $0.29 per month | 20 queries per day, 100 MB scanned data per query |
| Managed Grafana | $9.00 per month (optional) | One editor, five users |
| QuickSight | $33 per month (optional) | Five users |
| Total (estimate) | $16.77/month without Grafana or QuickSight; $25.77/month with QuickSight; $58.77/month with both Grafana and QuickSight | If you only need reporting, you can use QuickSight. CloudWatch dashboards can also replace Grafana (with some limits). |
More cost details are available here.
Conclusions
This post shows how to leverage AWS serverless services to perform SAP load and performance testing. By adopting cloud-native services, you get an efficient and cost-effective approach to conduct extensive load tests for SAP while gathering deep, actionable metrics. The approach illustrates how modern cloud capabilities transform traditional performance testing into a scalable, cost-effective, and data-driven process for SAP deployments.
Read more on the AWS for SAP blogs to get inspiration on how to get more out of your SAP investment, and start your load testing strategy today.
Join the SAP on AWS discussion
Beyond your account team and AWS Support, AWS provides public Q&A forums on re:Post. The AWS for SAP Solution Architecture team regularly monitors the AWS for SAP topic to help customers and partners. If your question is not support-related, consider joining the re:Post discussion to contribute to the community knowledge base.